Showing posts with label warppls. Show all posts
Showing posts with label warppls. Show all posts
Wednesday, December 10, 2025
Theory-driven multi-group analyses via latent growth with PLS-SEM: A two-stage anchor-factorial approach
The article below shows how one can conduct theory-driven multi-group analyses via latent growth, in the context of structural equation modeling via partial least squares (PLS-SEM).
Kock, N. (2025). Theory-driven multi-group analyses via latent growth with PLS-SEM: A two-stage anchor-factorial approach. Data Analysis Perspectives Journal, 6(4), 1-8.
Link to full-text file for this and other DAPJ articles:
https://scriptwarp.com/dapj/#Published_Articles
Abstract:
Classic multi-group analyses (MGAs) are plagued by two primary flaws: they require splitting samples into smaller subsamples, which complicates parameter comparisons due to reduced power and varying subsample characteristics; and they are typically exploratory rather than theory-driven. This paper addresses these issues by proposing a theory-driven MGA via latent growth method, using a two-stage anchor-factorial approach. The methodology is implemented within the context of structural equation modeling with partial least squares (PLS-SEM) using the WarpPLS software. The first stage involves creating and analyzing a target SEM model, and then converting a categorical grouping variable (e.g., Country) into a numeric latent growth variable (LGV) using an anchor-factorial conversion with variation sharing. The LGV is anchored on the latent variables involved in the hypothesized effects. The second stage involves inspecting the LGV's scores, related path coefficients, and 3D graphs to confirm the theory-driven effects. This approach offers a robust and theoretically superior alternative to classic MGA for assessing how multi-group influences affect model parameters.
Video demonstrating the techniques employed in the article:
Best regards to all!

Wednesday, December 3, 2025
Using conditional probabilistic queries for NCA and variants in PLS-SEM
The article below shows how one can use conditional probabilistic queries for NCA and variants in PLS-SEM. It focuses on necessary and sufficient conditions analyses (Jan Dul’s original NCA and variants) employing latent variables.
Kock, N. (2025). Using conditional probabilistic queries for NCA and variants in PLS-SEM. Data Analysis Perspectives Journal, 6(3), 1-6.
Link to full-text file for this and other DAPJ articles:
https://scriptwarp.com/dapj/#Published_Articles
Abstract:
We discuss the use of conditional probabilistic queries for necessary and sufficient conditions analyses (Jan Dul’s original NCA and variants) employing latent variables within the partial least squares structural equation modeling (PLS-SEM) context. While traditional PLS-SEM path coefficients establish linear causal links, they do not directly estimate the conditional probabilities central to NCA. These probabilities are crucial for both researchers and practitioners seeking a deeper understanding of necessary and sufficient conditions. This article demonstrates how to conduct bivariate and multivariate conditions analyses to systematically assess such relationships. Using an illustrative model analyzed with WarpPLS, we show how to identify specific levels of latent variables (e.g., job satisfaction and organizational commitment) that are necessary or sufficient to achieve a target outcome (e.g., above-average job performance). This methodology offers a powerful complement to classic SEM, allowing for the identification of essential prerequisites for desired outcomes.
Video demonstrating the techniques employed in the article:
Best regards to all!
Tuesday, January 14, 2025
Do employees care about diversity and inclusion? Why academic research should not be politically biased
The article below provides a good example of a robust path analysis employing WarpPLS. It suggests, among other things, that the degree to which a company promotes diversity and inclusion has a negligible effect on how an employee rates the company (which reflects job satisfaction). This is in fact not the main theme of the article, but it is something that received plenty of pushback from reviewers. The analysis was conducted a while ago, when research results that did not strongly support diversity and inclusion were typically viewed rather unfavorably by review panels in many academic journals. We thank the prestigious journal Personnel Review for their academic integrity.
Kock, N., Haddoud, M.Y., Onjewu, A.-K., & Yang, S. (2025). Unveiling workplace dynamics: Insights from voluntary disclosures on business outlook and CEO approval. Personnel Review, 54(2), 474–497.
Links to full-text versions of the article:
https://scriptwarp.com/pubs/Kock_etal_2025_PR_WorkplaceDynamics.pdf
https://pure-oai.bham.ac.uk/ws/portalfiles/portal/253297641/KockN2025Unveiling_AAM.pdf
https://www.emerald.com/insight/content/doi/10.1108/pr-03-2024-0251/full/html
Abstract:
Purpose: This inquiry extends the discourse on job satisfaction and employee referral. It aims to examine the moderating effects of perceived business outlook and CEO approval in the dynamics of job satisfaction and employee referral. A model predicting job satisfaction and employee referral through the lens of Herzberg’s two-factor theory is developed and tested. Design/methodology/approach: To remedy the overreliance on self-reported surveys, impeding generalization and representativeness, this study uses large evidence from 14,840 voluntary disclosures of US employees. A structural equation modeling technique is adopted to test the hypotheses. Findings: The inherent robust path analysis revealed intriguing findings highlighting culture and values as exerting the most substantial positive impact on job satisfaction, while diversity and inclusion played a relatively trivial role. Moreover, employees’ view of the firms’ outlook and their approval of the incumbent CEO were found to strengthen the job satisfaction–referral nexus. Originality/value: The study revisits the relationship between job satisfaction and employee referral by capturing the moderating effects of perceived business outlook and CEO approval. We believe that this investigation is one of the first to capture the impact of these two pivotal factors.
The figure below summarizes the results of the study. The overall rating variable reflects satisfaction with one’s job at a particular company, which predictably influences the probability that a person will recommend the company to a friend as a potential employer. If we had relied only on statistical significance tests, the effect of diversity and inclusion on job satisfaction would actually be negative and statistically significant. But based on the small effect size, we felt that it would be more scholarly to report the effect in question as indistinguishable from zero. With large samples, the likelihood of type I errors (false positives) increases dramatically in statistical significance tests, whether P values or confidence intervals are used.

Shiyu got us the awesome Glassdoor dataset, while Yacine and Adah-Kole did most of the theory development and later discussion work (thank you, my talented co-authors). The curious thing is that I did the analyses for this article, using WarpPLS and double-checking with other analysis tools, and was not only surprised but rather displeased with the results. But why was I displeased with the results? Well, as an academic, I work in a very diverse environment, and find that diversity stimulating. In particular, I am very interested about countries and regions (domestically and abroad), their cultures, and histories. Furthermore, as someone with a diverse background, I have lived in Brazil and New Zealand, before settling in the US. While in the US, Belgium was like a second home for several years, as I travelled there often to consult for the European Commission.
Yet, regardless of personal background, and for the sake of societal credibility, academics must report research results as they are, to the best of their ability. Furthermore, they must report research results independently from political orientation and how they personally feel about those results. Finally, they have to resign themselves to the fact that all empirical studies provide incomplete views of the world, and usually call for more research using different approaches and epistemologies.
Best regards to all!
PS: I thank Nadya Larumbe for her comments on a previous version of this post.
Saturday, November 9, 2024
A comparison of data analyses with WarpPLS and Stata: A study of trust and its role regarding internet use and subjective well-being
The article below provides a comparative assessment of analyses using the software packages WarpPLS and Stata, in the context of structural equation modeling via partial least squares (PLS-SEM), based on an illustrative study of trust and its role regarding internet use and subjective well-being.
Samak, A., Islam, M. R., & Hanke, D. (2024). A comparison of data analyses with WarpPLS and Stata: A study of trust and its role regarding internet use and subjective well-being. Data Analysis Perspectives Journal, 5(3), 1-6.
Link to full-text file for this and other DAPJ articles:
https://scriptwarp.com/dapj/#Published_Articles
Abstract:
This study investigates the mediating roles of social and institutional trust in the relationship between internet use and subjective well-being, using partial least squares (PLS)-based structural equation modeling (SEM). We compare WarpPLS 8.0 and Stata’s PLS-SEM package, utilizing data from the European Social Survey (ESS), round 8. Our results show consistent model fit and path coefficients across both tools, confirming the significant mediating effects of trust. WarpPLS stands out for its advanced model diagnostics, while Stata’s PLS-SEM excels in integrating with Stata’s broader data management and statistical analysis tools. This comparative analysis contributes to the SEM methodological literature.
Best regards to all!
Sunday, October 27, 2024
A comparison of multiple regression analyses in Stata and WarpPLS
The article below provides a comparative assessment of multiple regression analyses using the software packages WarpPLS and Stata.
Tarkom, A., & Gopal, P. (2024). A comparison of multiple regression analyses in Stata and WarpPLS. Data Analysis Perspectives Journal, 5(2), 1-8.
Link to full-text file for this and other DAPJ articles:
https://scriptwarp.com/dapj/#Published_Articles
Abstract:
This paper illustrates a comparative analysis of multiple regression analysis using two different software. The software packages used are WarpPLS 8.0 and Stata 17. Multiple regression analyses performed with both software produce the same results. WarpPLS 8.0 has the added advantage over Stata owing to its graphic user interface that aids in model specification and visualization. Furthermore, it provides users with additional tools to visualize moderating effects. Both software have equal accuracy in terms of the results but differences in terms of what they offer users.
Best regards to all!
Saturday, April 6, 2024
PLS Applications Symposium; 10-12 April 2024; Laredo, Texas
PLS Applications Symposium; 10-12 April 2024; Laredo, Texas
(Abstract submissions accepted until 16 February 2024)
*** Attendance (face-to-face or online) ***
The Symposium will be conducted as part of the multidisciplinary Annual Western Hemispheric Trade Conference, organized by the Center for the Study of Western Hemispheric Trade. Our workshop in PLS-SEM will be conducted entirely online. Our expectation is that participants will be allowed to attend Conference sessions either face-to-face or online.
When indicating the type of their submission, participants should indicate whether they intend to attend face-to-face or online. This should be done within parentheses after indicating the submission type. For example - "Type of submission: Presentation (online)".
*** Only abstracts are needed for the submissions ***
The partial least squares (PLS) method has increasingly been used in a variety of fields of research and practice, particularly in the context of PLS-based structural equation modeling (SEM). The focus of this Symposium is on the application of PLS-based methods, from a multidisciplinary perspective. For types of submissions, deadlines, and other details, please visit the Symposium’s web site:
https://plsas.net
*** Workshop on PLS-SEM ***
On 10 April 2024 a full-day workshop on PLS-SEM will be conducted only by Dr. Ned Kock and Dr. Geoffrey Hubona, using the software WarpPLS. Dr. Kock is the original developer of this software, which is one of the leading PLS-SEM tools today; used by thousands of researchers from a wide variety of disciplines, and from many different countries. Dr. Hubona has extensive experience conducting research and teaching topics related to PLS-SEM, using WarpPLS and a variety of other tools. This workshop will be hands-on and interactive, and will have two parts: (a) basic PLS-SEM issues, conducted in the morning (9 am - 12 noon) by Dr. Hubona; and (b) intermediate and advanced PLS-SEM issues, conducted in the afternoon (2 pm - 5 pm) by Dr. Kock. Participants may attend either one, or both of the two parts.
The following topics, among others, will be covered - Running a Full PLS-SEM Analysis - Conducting a Moderating Effects Analysis - Viewing Moderating Effects via 3D and 2D Graphs - Creating and Using Second Order Latent Variables - Viewing Indirect and Total Effects - Viewing Skewness and Kurtosis of Manifest and Latent Variables - Viewing Nonlinear Relationships - Solving Collinearity Problems - Conducting a Factor-Based PLS-SEM Analysis - Using Consistent PLS Factor-Based Algorithms - Exploring Statistical Power and Minimum Sample Sizes - Exploring Conditional Probabilistic Queries - Exploring Full Latent Growth - Conducting Multi-Group Analyses - Assessing Measurement Invariance - Creating Analytic Composites.
-----------------------------------------------------------
Ned Kock
Symposium Chair
https://plsas.net
Wednesday, December 13, 2023
ICIS 2023: Why I love India so much!
In a few hours I’ll be returning to the Great State of Texas from India, where I’ve been attending the ICIS 2023 Conference. I had the opportunity to meet with WarpPLS users, which I always enjoy very much, and with methodological researchers doing PLS-related work.
Talking about people doing PLS-related work, it was a special treat to be able to meet and talk with Nicholas Danks. The man is a true scholar and a genius. I hope to collaborate with him in the future, and (perhaps, if I am lucky) get some of that talent through osmosis.
Another highlight was talking again with the incomparable Dr. Boo. I was busy distracting her with nonsense when her name was mentioned at the awards ceremony. For those of you who don’t know, she is one of the forerunners of the field of Information Systems, a field that she begun influencing at the young age of 13 (according to my calculations).
This was my first time in India. I loved it so much! This was such a nice experience in no small measure due to Glory George, who was kind enough to show me some of Hyderabad. The people of India are so smart and hard working. Take for example the person on the photo below; he solved a 100-year-old numeric computing problem while riding on the back of a bike in heavy traffic!

Okay, just my imagination. But he was indeed doing what seemed to be some coding, using his friend’s constantly moving upper back as a table. By the way, if you think that traffic in India is chaotic, think again. Those who pay close attention will notice that there is method to what looks like disorderly flow. More than method actually, it is a form of art. Just don’t try driving if you are a beginner; it will be like challenging Ma Long to a “ping pong” match.
Should you want to see and hear the person who is writing this, in keeping with media naturalness theory, check this video. More views and likes will help make my dear friends Steve Harmon and Rolando Santos happy about their masterful video creation and editing work.
Best regards to all!
Friday, October 27, 2023
WarpPLS: A bit of history
The YouTube video linked below (scroll down to the end of the news article) provides a bit of history in connection with the development of WarpPLS. A big thank you to Rolando Santos for his professional video creation work!
https://www.tamiu.edu/newsinfo/2023/10/topworldresearcher10262023.shtml
Best regards to all!
Saturday, December 3, 2022
PLS Applications Symposium; 12-14 April 2023; Laredo, Texas
PLS Applications Symposium; 12-14 April 2023; Laredo, Texas
(Abstract submissions accepted until 17 February 2023)
*** Attendance (face-to-face or online) ***
The Symposium will be conducted as part of the multidisciplinary Annual Western Hemispheric Trade Conference, organized by the Center for the Study of Western Hemispheric Trade. Our workshop in PLS-SEM will be conducted entirely online. Our expectation is that participants will be allowed to attend Conference sessions either face-to-face or online.
When indicating the type of their submission, participants should indicate whether they intend to attend face-to-face or online. This should be done within parentheses after indicating the submission type. For example - "Type of submission: Presentation (online)".
*** Only abstracts are needed for the submissions ***
The partial least squares (PLS) method has increasingly been used in a variety of fields of research and practice, particularly in the context of PLS-based structural equation modeling (SEM). The focus of this Symposium is on the application of PLS-based methods, from a multidisciplinary perspective. For types of submissions, deadlines, and other details, please visit the Symposium’s web site:
https://plsas.net
*** Workshop on PLS-SEM ***
On 12 April 2023 a full-day workshop on PLS-SEM will be conducted by Dr. Ned Kock and Dr. Geoffrey Hubona, using the software WarpPLS. Dr. Kock is the original developer of this software, which is one of the leading PLS-SEM tools today; used by thousands of researchers from a wide variety of disciplines, and from many different countries. Dr. Hubona has extensive experience conducting research and teaching topics related to PLS-SEM, using WarpPLS and a variety of other tools. This workshop will be hands-on and interactive, and will have two parts: (a) basic PLS-SEM issues, conducted in the morning (9 am - 12 noon) by Dr. Hubona; and (b) intermediate and advanced PLS-SEM issues, conducted in the afternoon (2 pm - 5 pm) by Dr. Kock. Participants may attend either one, or both of the two parts.
The following topics, among others, will be covered - Running a Full PLS-SEM Analysis - Conducting a Moderating Effects Analysis - Viewing Moderating Effects via 3D and 2D Graphs - Creating and Using Second Order Latent Variables - Viewing Indirect and Total Effects - Viewing Skewness and Kurtosis of Manifest and Latent Variables - Viewing Nonlinear Relationships - Solving Collinearity Problems - Conducting a Factor-Based PLS-SEM Analysis - Using Consistent PLS Factor-Based Algorithms - Exploring Statistical Power and Minimum Sample Sizes - Exploring Conditional Probabilistic Queries - Exploring Full Latent Growth - Conducting Multi-Group Analyses - Assessing Measurement Invariance - Creating Analytic Composites.
-----------------------------------------------------------
Ned Kock
Symposium Chair
https://plsas.net
Wednesday, November 23, 2022
Model-driven data analytics (MDDA): Resources for teachers and students
The technique of model-driven data analytics (MDDA) involves the creation of a path model expressing an applied theory, and testing the model using path analysis with latent variables. The latter, path analysis with latent variables, is generally known as structural equation modeling (SEM).
MDDA emerged from the work of a special category of users of the software WarpPLS – data analysis consultants, who regularly work with organizations to provide data-driven recommendations.
While MDDA can be implemented through a variety of software tools, it has found wide adoption among WarpPLS users, because of the many powerful features of this software that can be used in this context. Moreover, in WarpPLS all analyses are model-driven, which makes this software much more user-friendly than other software tools that rely on extensive scripting to conduct analyses.
The website linked below provides several resources for teachers and students, including: a textbook, which may be used by teachers of university courses on MDDA, as a free online document; datasets, which include not only data, but also scenarios, questions, and variables (these are used to illustrate how MDDA can be used to address the needs of various organizations); and YouTube videos, which provide step-by-step illustrations of how to analyze data in the context of scenarios, questions, and variables.
https://scriptwarp.com/mdda
Best regards to all!
Saturday, November 12, 2022
A thank you note to the workshop participants at The University of Texas at El Paso
This is just at thank you note to the College of Business Administration at The University of Texas at El Paso for hosting me on 10-11 November 2022 for a workshop on SEM using the software WarpPLS.

Special thanks go to Dr. Kevin Dow, his wonderful team at the Accounting and Information Systems Department, and those who participated in the workshop.
Several of the participants had quite a great deal of expertise in SEM and WarpPLS. It was a joy to conduct the workshop, and answer some very insightful questions!
Thank you and best regards to all!
Ned Kock
https://nedkock.com
Friday, October 21, 2022
Dichotomous variables
There are several ways in which a model with an endogenous dichotomous variable can be analyzed in PLS-SEM - via the logistic regression variables technique, without any additional treatment, and via the conditional probabilistic queries technique. Below we discuss the first two options.
Logistic regression variables technique
Starting in version 8.0 of WarpPLS, the menu option “Explore logistic regression” allows you to create a logistic regression variable as a new indicator that has both unstandardized and standardized values. Logistic regression is normally used to convert an endogenous variable on a non-ratio scale (e.g., dichotomous) into a variable reflecting probabilities. You need to choose the variable to be converted, which should be an endogenous variable, and its predictors.
The new logistic regression variable is meant to be used as a replacement for the endogenous variable on which it is based. Two algorithms are available: probit and logit. The former is recommended for dichotomous variables; the latter for non-ratio variables where the number of different values (a.k.a. “distinct observations”) is greater than 2 but still significantly smaller than the sample size; e.g., 10 different values over a sample size of 100. The unstandardized values of a logistic regression variable are probabilities; going from 0 to 1.
Since a logistic regression variable can be severely collinear with its predictors, you can set a local full collinearity VIF cap for the logistic regression variable. Predictor-criterion collinearity, or lateral collinearity, is rarely assessed or controlled in classic logistic regression algorithms.
For more on this topic, see the links below.
Explore Logistic Regression in WarpPLS
Using Logistic Regression in PLS-SEM with Composites and Factors
Without any additional treatment
Below is a model with a dichotomous dependent variable - Effe. The variable assumes two values, 0 or 1, to reflect low or high levels of "effectiveness".
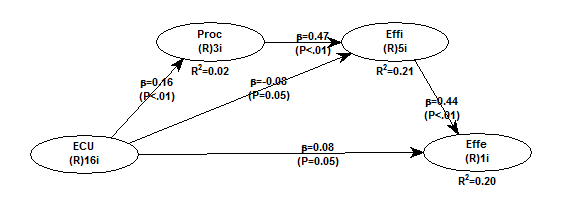
The graph below shows the expected values of Effe given Effi. The latter is one of the LVs that point at Effe in the model. The values of Effe and Effi are unstandardized.

Arguably a model with a dichotomous dependent variable cannot be viably tested with ordinary multiple regression because the dependent variable is not normally distributed (as it assumes only two values).
The graph below shows a histogram with the distribution of values of Effe. This variable's skewness is -0.423 and excess kurtosis is -1.821.

This is not a problem for WarpPLS because P values are calculated via nonparametric techniques that do not assume in their underlying design that any variables in the model meet parametric expectations; such as the expectations of univariate and multivariate unimodality and normality.
If a dependent variable refers to a probability (as in logistic regression), and is expected to be associated with a predictor according to a logistic function, you should use the Warp3 or Warp3 basic inner model algorithms to relate the two variables.
Saturday, April 9, 2022
A thank you note to the participants in the 2022 PLS Applications Symposium
This is just a thank you note to those who participated, either as presenters or members of the audience, in the 2022 PLS Applications Symposium:
https://plsas.net/
As in previous years, it seems that it was a good idea to run the Symposium as part of the Western Hemispheric Trade Conference. This allowed attendees to take advantage of a subsidized registration fee, and also participate in other Conference sessions and the Conference's social event.
I have been told that the proceedings will be available soon, if they are not available yet, from the Western Hemispheric Trade Conference web site, which can be reached through the Symposium web site (link above).
Also, we had a nice full-day workshop on PLS-SEM using the software WarpPLS. This workshop, conducted by Dr. Jeff Hubona and myself, was fairly hands-on and interactive. Some participants had quite a great deal of expertise in PLS-SEM and WarpPLS. It was a joy to conduct the workshop!
As soon as we define the dates, we will be announcing next year’s PLS Applications Symposium. Like this years’ Symposium, it will take place in Laredo, Texas, probably in the first half of April as well.
Thank you and best regards to all!
-----------------------------------------------------------
Ned Kock
Symposium Chair
https://plsas.net/
Saturday, March 5, 2022
Minimum sample size estimation in SEM: Contrasting results for models using composites and factors
The article below discusses how one can conduct a minimum sample size estimation, contrasting results for models using composites and factors, in the context of structural equation modeling via partial least squares (PLS-SEM).
Ezeugwa, B., Talukder, M. F., Amin, M. R., Hossain, S. I., & Arslan, F. (2022). Minimum sample size estimation in SEM: Contrasting results for models using composites and factors. Data Analysis Perspectives Journal, 3(4), 1-7.
Link to full-text file for this and other DAPJ articles:
https://scriptwarp.com/dapj/#Published_Articles
Abstract:
Estimating the minimum required sample size is an essential issue for studies that use structural equation modeling employing partial least squares (PLS-SEM). Several PLS-SEM-based studies ignore this critical step or use simple techniques, which lead to inaccurate sample size estimations. This paper illustrates two effective heuristic methods to estimate the minimum required sample size using WarpPLS, a leading PLS-SEM software tool.
Best regards to all!
Saturday, December 18, 2021
Discriminant validity assessment in PLS-SEM: A comprehensive composite-based approach
The article below puts forth a comprehensive composite-based perspective on how one can conduct discriminant validity assessment, in the context of structural equation modeling via partial least squares (PLS-SEM).
Rasoolimanesh, S. M. (2022). Discriminant validity assessment in PLS-SEM: A comprehensive composite-based approach. Data Analysis Perspectives Journal, 3(2), 1-8.
Link to full-text file for this and other DAPJ articles:
https://scriptwarp.com/dapj/#Published_Articles
Abstract:
This paper aims to discuss modern approaches to assess discriminant validity in the context of structural equation modeling via partial least squares (PLS-SEM). It illustrates the application of these approaches using the WarpPLS 7.0 software. The Fornell-Larcker criterion, crossloadings method, heterotrait-monotrait (HTMT) ratio, and full collinearity test have been discussed in this paper. A step-by-step guide is provided to assess discriminant validity using these four tests in WarpPLS 7.0. The first three criteria are applicable for reflective constructs, while the full collinearity test can be applied for both reflective and formative constructs. In different social science disciplines, a combination of reflective and formative constructs is a common practice, therefore reporting the full collinearity test for the assessment of discriminant validity can be an advantage.
Best regards to all!
Saturday, December 11, 2021
Reliability assessment in SEM models with composites and factors: A modern perspective
The article below puts forth a modern perspective on how one can conduct reliability assessments in models with composites and factors, in the context of structural equation modeling via partial least squares (PLS-SEM).
Canatay, A., Emegwa, T., Lybolt, L. M. & Loch, K. D. (2022). Reliability assessment in SEM models with composites and factors: A modern perspective. Data Analysis Perspectives Journal, 3(1), 1-6.
Link to full-text file for this and other DAPJ articles:
https://scriptwarp.com/dapj/#Published_Articles
Abstract:
This paper’s focus is on reliability tests for both composite-based and factor-based analysis algorithms in structural equation modeling through partial least squares (PLS-SEM). We illustrate this analysis employing a widely used PLS-SEM software tool, WarpPLS. The results show the magnitude of differences between the two approaches, suggesting that the estimates of coefficients obtained using the factor-based approach are more conservative than those obtained using the corresponding composite-based approach.
Best regards to all!
Wednesday, December 1, 2021
Moderated mediation, segmentation delta method, J-curve emergence, and causality assessment: Article
The article below discusses moderated mediation and the related emergence of J-curve relationships, in a context that is relevant to researchers employing structural equation modeling via partial least squares (PLS-SEM).
The article lays out three steps to combine moderation and J-curve analyses, with the goal of more fully understanding the underlying moderated mediation relationships. It proposes a new segmentation delta method to test for J-curve emergence, as part of this framework.
Finally, the article discusses three causality assessment indices that are used to show that the model used in the article is generally sound in terms of causality.
Kock, N. (2021). Moderated mediation and J-curve emergence in path models: An information systems research perspective. Journal of Systems and Information Technology, 23(3), 303-321.
Link to full-text file for this article:
Click for PDF file
Abstract (structured):
Purpose. J-curve relationship analyses can provide valuable insights to information systems (IS) researchers. We discuss moderated mediation in IS research and the related emergence of J-curve relationships. Design/methodology/approach. Building on an illustrative study in the field of IS, we lay out three steps to combine moderation and J-curve analyses, with the goal of more fully understanding the underlying moderated mediation relationships. We propose a new segmentation delta method to test for J-curve emergence, as part of this framework. Findings. We show, in the context of this study, the complementarity of moderation and J-curve analyses. Research limitations/implications. Currently, IS researchers rarely conduct moderation and J-curve analyses in a complementary way, even though there are software tools, and related methods, which allow them to do so in a relatively straightforward way. Originality/value. Our analyses were conducted with the software WarpPLS, a widely used tool that allows for moderated mediation and J-curve analyses, in a way that is fully compatible with the set of steps presented in this paper.
Best regards to all!
Wednesday, November 24, 2021
PLS Applications Symposium; 6-8 April 2022; Laredo, Texas
PLS Applications Symposium; 6-8 April 2022; Laredo, Texas
(Abstract submissions accepted until 18 February 2022)
*** Attendance (face-to-face or online) ***
The Symposium will be conducted as part of the multidisciplinary Annual Western Hemispheric Trade Conference, organized by the Center for the Study of Western Hemispheric Trade. Our workshop in PLS-SEM will be conducted entirely online. Our expectation is that participants will be allowed to attend Conference sessions either face-to-face or online.
When indicating the type of their submission, participants should indicate whether they intend to attend face-to-face or online. This should be done within parentheses after indicating the submission type. For example - "Type of submission: Presentation (online)".
Due to the uncertainty of the COVID-19 pandemic, the Center reserves the right to transition to a fully virtual Conference to comply with guidelines from the CDC as well as state and local governments.
*** Only abstracts are needed for the submissions ***
The partial least squares (PLS) method has increasingly been used in a variety of fields of research and practice, particularly in the context of PLS-based structural equation modeling (SEM). The focus of this Symposium is on the application of PLS-based methods, from a multidisciplinary perspective. For types of submissions, deadlines, and other details, please visit the Symposium’s web site:
https://plsas.net
*** Workshop on PLS-SEM ***
On 6 April 2022 a full-day workshop on PLS-SEM will be conducted by Dr. Ned Kock and Dr. Geoffrey Hubona, using the software WarpPLS. Dr. Kock is the original developer of this software, which is one of the leading PLS-SEM tools today; used by thousands of researchers from a wide variety of disciplines, and from many different countries. Dr. Hubona has extensive experience conducting research and teaching topics related to PLS-SEM, using WarpPLS and a variety of other tools. This workshop will be hands-on and interactive, and will have two parts: (a) basic PLS-SEM issues, conducted in the morning (9 am - 12 noon) by Dr. Hubona; and (b) intermediate and advanced PLS-SEM issues, conducted in the afternoon (2 pm - 5 pm) by Dr. Kock. Participants may attend either one, or both of the two parts.
The following topics, among others, will be covered - Running a Full PLS-SEM Analysis - Conducting a Moderating Effects Analysis - Viewing Moderating Effects via 3D and 2D Graphs - Creating and Using Second Order Latent Variables - Viewing Indirect and Total Effects - Viewing Skewness and Kurtosis of Manifest and Latent Variables - Viewing Nonlinear Relationships - Solving Collinearity Problems - Conducting a Factor-Based PLS-SEM Analysis - Using Consistent PLS Factor-Based Algorithms - Exploring Statistical Power and Minimum Sample Sizes - Exploring Conditional Probabilistic Queries - Exploring Full Latent Growth - Conducting Multi-Group Analyses - Assessing Measurement Invariance - Creating Analytic Composites.
-----------------------------------------------------------
Ned Kock
Symposium Chair
https://plsas.net
Monday, October 25, 2021
Common structural variation reduction in PLS-SEM: Replacement analytic composites and the one fourth rule
The article below explains how one can accomplish a common structural variation reduction, via replacement analytic composites and the one fourth rule, in the context of structural equation modeling via partial least squares (PLS-SEM).
Kock, N. (2021). Common structural variation reduction in PLS-SEM: Replacement analytic composites and the one fourth rule. Data Analysis Perspectives Journal, 2(5), 1-6.
Link to full-text file for this and other DAPJ articles:
https://scriptwarp.com/dapj/#Published_Articles
Abstract:
Path coefficients may be distorted, in the context of structural equation modeling via partial least squares (PLS-SEM), due to excess common structural variation shared in a model. This may be caused by methodological issues; e.g., the use of highly correlated but conceptually distinct latent variables, or common method bias. We discuss a common structural variation reduction procedure using WarpPLS, a leading PLS-SEM software tool. This procedure relies on the creation of analytic composites as replacements for latent variables, where the weights are one fourth of the original path coefficients among the latent variables and their predictors in the structural model, and with signs that are the opposites of the signs of the original path coefficients.
Best regards to all!
Saturday, July 3, 2021
Testing a moderated mediation in PLS-SEM: A full latent growth approach
The article below explains how one can test moderated mediation effects in the context of structural equation modeling via partial least squares (PLS-SEM).
Hubona, G., & Belkhamza, Z. (2021). Testing a moderated mediation in PLS-SEM: A full latent growth approach. Data Analysis Perspectives Journal, 2(4), 1-5.
Link to full-text file for this and other DAPJ articles:
https://scriptwarp.com/dapj/#Published_Articles
Abstract:
There are various techniques for separately analyzing moderation and mediation effects in partial least squares structural equation models (PLS-SEM). These individual techniques are rather straightforward and widely understood. However, valid approaches for testing more complex moderated mediation effects that are embedded together in a single model are less well understood. In this paper, we explain and illustrate one approach to such an analysis using a complex model with numerous embedded moderated mediation relationships utilizing WarpPLS, a leading PLS-SEM software tool.
Enjoy!
Subscribe to:
Posts (Atom)
